You may want to plot a constant, for instance to combine with another plot. To do this you specify the constant without a function and the domain within which you want to plot the function.
Plot[5, {x, 0, 5}]
Suppose you want to plot a constant x value for all y. That's not a function and Plot won't work. For instance, you may want to plot a vertical asymptote and while Mathematica will plot vertical asymptotes for some functions (see the plot for Tan@x in tutorial/Basic Plotting), it may not for all. Here is one method. Note that any number followed by pure Function "&" makes a constant Function for that number's value. In other words, the constant Function yields the constant no matter what number it is applied to.
4.5 & /@ {5, 28.6, Pi, E}
{4.5, 4.5, 4.5, 4.5}
Here we use the constant pure Function to create the x-values as just shown. Thread with List creates the 50 pairs of y-values for x = 7.
Thread[List[7 & /@ Range[0, 50], Range[0, 50]]] // Short
ListLinePlot[Thread[List[7 & /@ Range[0, 50], Range[0, 50]]]]

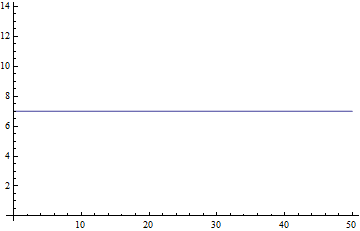
And so this is also a way to plot a constant y value by using the constant Function for the range instead of the domain.
ListLinePlot[Thread[List[Range[0, 50], 7 & /@ Range[0, 50]]]]

No comments:
Post a Comment