When working with equations, use Plot to visualize them. Further, a simple but powerful method to solve them is:
Here's a short example adapted from The Student's Introduction to Mathematica. What is instructive is they Plot the two components of the equation separately. Analyzing and plotting each term separately is essential to understanding the equation as a whole.
Use TraditionalForm to put an expression in traditional math format:
Sin@x==x-1//TraditionalForm
sin(x) = x – 1
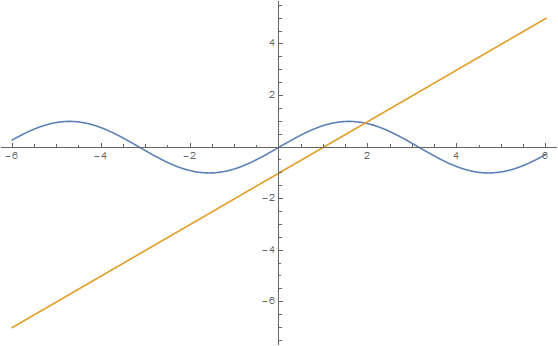
With Plot we visualize the two terms of the equation as separate functions and their intersection, indicating where they zero each other out near x = 2. Giving Plot the two terms in a List says 'Plot y = sin(x) and y = x - 1 together.' The first function is blue, the second, yellow.
Plot[{Sin@x, x - 1}, {x, -6, 6}]
Since we have flushed out a root, we can use FindRoot to precisely locate it, supplying FindRoot with a guess that it's near x = 2. Giving FindRoot a single coordinate causes it to use the Newton-Raphson method, while giving it two coordinates causes it to use a secant method.
soln1=FindRoot[Sin@x==x-1,{x,2}]
{x->1.93456}
Always verify the solution.
Sin@x==x-1/.soln1
True
- Plot the equation
- Find an x-value close to a root
- Use that value as the initial guess x0 in FindRoot, which uses numerical methods
Here's a short example adapted from The Student's Introduction to Mathematica. What is instructive is they Plot the two components of the equation separately. Analyzing and plotting each term separately is essential to understanding the equation as a whole.
Use TraditionalForm to put an expression in traditional math format:
Sin@x==x-1//TraditionalForm
sin(x) = x – 1
With Plot we visualize the two terms of the equation as separate functions and their intersection, indicating where they zero each other out near x = 2. Giving Plot the two terms in a List says 'Plot y = sin(x) and y = x - 1 together.' The first function is blue, the second, yellow.
Plot[{Sin@x, x - 1}, {x, -6, 6}]
soln1=FindRoot[Sin@x==x-1,{x,2}]
{x->1.93456}
Always verify the solution.
Sin@x==x-1/.soln1
True


No comments:
Post a Comment